

nano-benchmark provides command-line utilities for benchmarking JavaScript code — hot
loops, ms-scale operations, whole commands, and code in browsers — with nonparametric
statistics and significance testing.
Eight utilities are available:
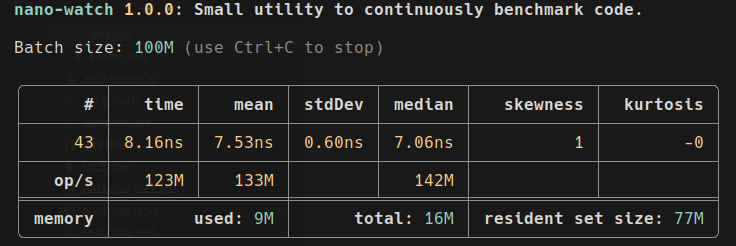
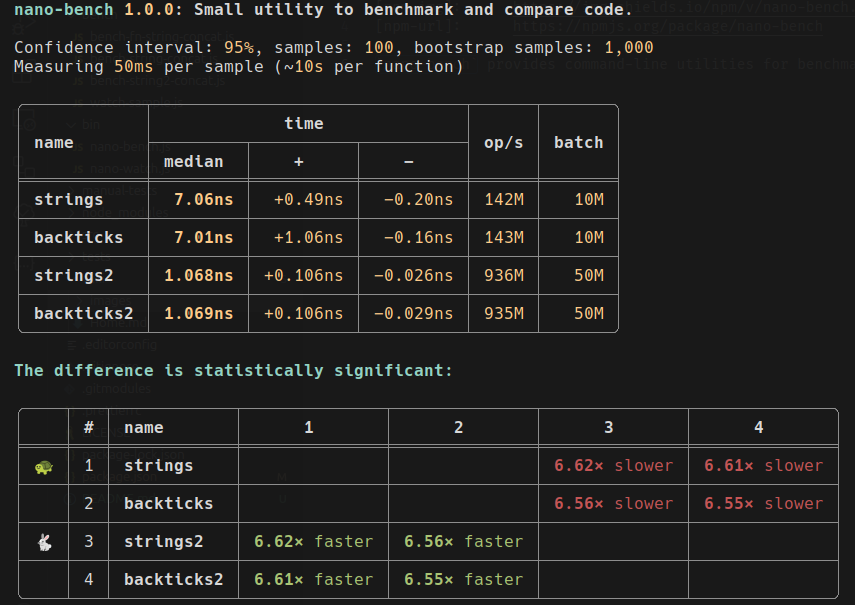
nano-watch— continuously benchmarks a single function, showing live statistics and memory usage.nano-bench— benchmarks and compares multiple functions, calculating confidence intervals and statistical significance.nano-bench-io— benchmarks slow (ms-scale) functions and whole commands one run at a time — distributions and tail percentiles (p90/p99), no batching, optionally under load.nano-bench-compare— views and compares saved results (JSON), recomputing significance from the raw samples — for before/after comparisons across runs.nano-bench-view— serves a browser viewer for saved results: distribution plots, summary, and significance, with folder listings for browsing a remote machine's files. The same page runs bench files in a browser.nano-bench-playwrightandnano-bench-puppeteer— run a bench file in browsers from the command line and print the results asnano-benchdoes.nano-bench-suite— runs several bench files, each in its own process, over one or more passes, and reports which function was fastest in each file and how often that held.
Designed for performance tuning, from small snippets in tight loops to slow operations under load.
npm install nano-benchmarkUse --self to get the script path for Deno and Bun:
npx nano-bench benchmark.js
bun `npx nano-bench --self` benchmark.js
deno run --allow-read --allow-hrtime `npx nano-bench --self` benchmark.js
deno run -A `npx nano-bench --self` benchmark.js
node `npx nano-bench --self` benchmark.js
For Deno, --allow-read is required and --allow-hrtime is recommended.
Use -A for convenience in safe environments.
With a global install (npm install -g nano-benchmark) both utilities are available by name.
Otherwise, prefix with npx (e.g., npx nano-watch) or add them to your package.json scripts.
Run with --help for details on arguments.
Both utilities import a module and benchmark its (default) export.
nano-bench expects an object whose properties are the functions to compare.
nano-watch accepts the same format or a single function.
Name one or more methods after the file to benchmark just those. A single method runs as a baseline — its statistics are reported with no significance test (there is nothing to compare it against in isolation).
Example module for nano-bench (bench-strings-concat.js):
export default {
  strings: n => {
    const a = 'a',
      b = 'b';
    for (let i = 0; i < n; ++i) {
      const x = a + '-' + b;
    }
  },
  backticks: n => {
    const a = 'a',
      b = 'b';
    for (let i = 0; i < n; ++i) {
      const x = `${a}-${b}`;
    }
  },
  join: n => {
    const a = 'a',
      b = 'b';
    for (let i = 0; i < n; ++i) {
      const x = [a, b].join('-');
    }
  }
};
Usage:
npx nano-bench bench-strings-concat.js                 # compare all three
npx nano-bench bench-strings-concat.js strings join    # compare just these two
npx nano-bench bench-strings-concat.js strings         # baseline one (no significance test)
npx nano-watch bench-strings-concat.js backticksBefore committing to a long collection run, validate the module with --smoke:
each selected function is called once (n = 1) and reported ok/failed with a
rough duration. The exit code is non-zero if any function throws or rejects,
and the tool exits promptly even if the module holds live handles (servers,
watchers):
npx nano-bench bench-strings-concat.js --smokeFor two functions nano-bench uses the Mann-Whitney U test; for three or more, the
Kruskal-Wallis H test with a Conover-Iman pairwise post-hoc. Because running many
pairwise comparisons inflates the chance of a false "significant", the post-hoc is
corrected for multiple comparisons by default. Choose the method with
--correction <none|holm|bonferroni> (default holm, which is uniformly more
powerful than Bonferroni); none reproduces an uncorrected post-hoc. For two
functions the effect size is reported next to the verdict (Cliff's δ with
a magnitude label, and how often the faster wins a random pair of runs) —
significance says a difference exists, the effect size says how much. For three or
more, a matrix of Cliff's δ for every pair follows the significance table.
--gc once or --gc each forces a garbage collection before sampling or before
every sample, outside the timed window. Add -v /
--verbose to see the test statistic, critical value, and per-comparison α.
A median and confidence interval can't show multimodality, skew, or outlier tails
(GC pauses, JIT warmup). Pass --histogram to draw each function's sample
distribution inline in the terminal, on a shared scale so the shapes are comparable:
npx nano-bench bench-strings-concat.js --histogram                 # vertical columns
npx nano-bench bench-strings-concat.js --histogram --chart bars    # horizontal bars
npx nano-bench bench-strings-concat.js --histogram --bins 24       # override bin count
Use --no-emoji for ASCII markers on terminals with unreliable emoji widths.
Without --histogram, nano-bench still runs a dip test on every function and prints a
warning when its samples look multimodal. That usually means some batches paid a garbage
collection or a slow path and others didn't, so the median describes only the fast clump.
Measure such code with nano-bench-io, which times one call per run and reports the tail.
A second warning names a common cause: another program competing for the CPU. For each
sample of a synchronous function, nano-bench compares the CPU time its thread used with the
elapsed time; a sample that got less than 90% of it was preempted. When 10% or more of a
function's samples were, the run says so, and the numbers read slow and noisy, often with a
multimodal warning too. Rerun when the machine is quiet. It can't see slowdowns that don't
take the CPU away, such as a busy sibling hyperthread.
Those slowdowns are large. On a 2-core, 4-thread laptop CPU (Intel i3-10110U) with Node.js 26, two concurrent copies of a CPU-bound benchmark ran 8.5% slower in every run, and the warning stayed quiet in all of them. Four copies slowed both a CPU-bound and a memory-bound benchmark by 25–30%, and the warning fired in a quarter to a half of those runs. Run one benchmark at a time. For the method and the numbers, see Parallel benchmark processes.
Functions measured in one run also share JIT and heap state. To confirm a small difference,
benchmark each variant in its own process and compare the saved runs with
nano-bench-compare.
Functions measured in one run share a process: its JIT decisions, code layout, and heap, so
one function can change what another measures. In bench/bench-substrings.js, the variants
that allocate triggered garbage collections that flattened the shared input string, and
using index measured 20% faster beside them than alone. --isolate measures each function
in its own process, and --repeat N runs N processes per function to show how much a result
varies between processes of the same code (under 1% for that function once its input was
flat):
npx nano-bench bench-strings-concat.js --isolate              # one process per function
npx nano-bench bench-strings-concat.js --isolate --repeat 5   # five per function
The parent calibrates once and gives every process the same batch size, and each process
drops its first sample, which pays for JIT warmup. With --repeat above 1, the significance
test compares the per-process medians, and a line reports which function was fastest in each
round of processes. --order sets the order the processes start in (interleaved by default).
Each extra process costs roughly its startup (about 0.15 seconds on Node.js) plus its samples.
With --verbose, each function's per-process medians are listed too.
nano-bench-suite runs every file in its own process, as many passes as you ask for, and
closes with a table: the fastest function in each file, and in how many passes it was fastest
with a significant difference. Options after -- go to every run:
npx nano-bench-suite 'bench/bench-*.js' --passes 5 -- -s 200
npx nano-bench-suite --io 'bench/io-*.js' -- -r 50To see how functions scale, export a factory and the values to run it with. The factory's setup stays outside the timing, each value runs in its own process as its own comparison, and a closing table gives the median per call for every function and value:
export const params = [100, 1000, 10000];

export default size => {
  const data = Array.from({length: size}, (_, i) => i); // setup, outside the timing
  return {
    'for loop': n => {
      let sum = 0;
      for (let k = 0; k < n; ++k) for (let i = 0; i < data.length; ++i) sum += data[i];
      return sum;
    },
    reduce: n => {
      let sum = 0;
      for (let k = 0; k < n; ++k) sum += data.reduce((a, b) => a + b, 0);
      return sum;
    }
  };
};
--params 10,100 overrides the list from the command line. Both nano-bench and
nano-bench-io accept such files, and nano-bench-suite reports each value on its own row.
Write a run to a JSON file with --json, then view or compare saved runs with
nano-bench-compare. Comparison recomputes significance from the raw samples (no
re-measuring), pairs same-named functions across files by default, and warns when the
runs' environments differ:
npx nano-bench bench-strings-concat.js --json before.json --label before
# ...change the code...
npx nano-bench bench-strings-concat.js --json after.json --label after

npx nano-bench-compare before.json after.json            # before/after, paired by name
npx nano-bench-compare before.json after.json --pooled   # one omnibus over all series
npx nano-bench-compare after.json                         # just re-render a saved run
The seed for the bootstrap is always recorded, so a recompare reproduces the original
intervals exactly. Add --host (or --host-name <name>) to stamp the machine into the
JSON.
nano-bench-view starts a local web server over a folder and opens a viewer for the results
JSON files under it. The viewer plots each function's sample distribution next to the summary
and significance tables. It computes the same numbers as nano-bench-compare, from the same
saved samples. The server uses tape-six, an optional
peer dependency, so install it first:
npm install --save-dev tape-six

npx nano-bench-view                     # list the results under the current folder
npx nano-bench-view after.json          # print a URL that opens this file directly
npx nano-bench-view --host 0.0.0.0      # listen on every interface, not only localhost
Warning
The server is a development tool. It isn't hardened and isn't meant for general web serving.
You are responsible for its security, and outside localhost you are on your own. To reach
a remote machine, prefer an SSH tunnel to the default localhost binding over --host.
The viewer lists result files found on the server, so it works when the results live on
another machine: run the command there, forward its port over SSH (for example,
ssh -L 3000:localhost:3000 HOST), then open the printed URL in a local browser. Folders
without an index.html file show a directory listing with links into the viewer. The page
follows the system's light or dark theme, and a switch overrides it.
Beside the summary and the distribution chart, the viewer shows what a file recorded: the load
table of nano-bench-io --in-flight or --rate, the --settle verdicts, -M metrics, and a
scaling table when the files are runs of one parameterized file. A multimodal distribution is
split into clusters, each with its weight, median, and range, and colored to match on the chart.
The chart also draws violins, and the chosen view is kept in the page URL.
The same server runs bench files in the browser. The start page lists the bench files under the
root (bench/bench-*.js and *.bench.js). Open a bench file… runs a local one, and so
does dropping a file on the page or pasting code into its text box. Each function runs in its
own iframe, one sample of each function per round, as in nano-bench. With Run each function
in a cross-site frame, the frames come from the other loopback name (127.0.0.1 for a page on
localhost), so browsers that isolate sites give each function its own process. The
results are saved to nano-bench-results/<bench>-<browser>.json under the root and open in the
viewer, so nano-bench-compare can read them too. The page is cross-origin isolated, which
gives performance.now() a 5–20 µs step instead of 0.1–1 ms. Browsers grant
isolation only over HTTPS or localhost, so open a remote server through an SSH tunnel; otherwise
the run still works, and the results carry a warning with the timer step.
Add ms and samples to the run URL to change the sample length and count, for example
/--nano-bench/web-app/?run=bench/bench-sort.js&samples=50. Keep the tab visible: the runner
pauses while the tab is hidden and records the pauses. A local file can't import other local
files, so bench it from the server when it has relative imports.
To run the same page from the command line, use nano-bench-playwright or
nano-bench-puppeteer. Each starts the server on localhost, runs the file in one browser after
another, prints each browser's tables, and exits with a non-zero status if a browser fails. The
driver is an optional peer dependency, so install it and its browsers first:
npm install --save-dev tape-six playwright
npx playwright install chromium firefox webkit

npx nano-bench-playwright bench/bench-sort.js                   # Chromium
npx nano-bench-playwright bench/bench-sort.js -b firefox,webkit # one after another
npx nano-bench-puppeteer bench/bench-sort.js -b chrome,firefox  # with Puppeteer
Playwright's WebKit is a build of its own, separate from Safari and Epiphany. To measure those engines, open the page in them.
Batching is right for nanosecond loops but erases the run-to-run distribution of
slow operations. nano-bench-io runs each function once per run (n = 1) and
reports p90/p99 tails alongside the median and its confidence interval — for
I/O-bound and other ms-scale code where the tail is the story:
npx nano-bench-io io-bench.js                # at least 10 runs and 5 s per function
npx nano-bench-io io-bench.js -r 50          # exactly 50 runs
npx nano-bench-io io-bench.js --stable 5     # run until the median CI is within 5%
With two or more functions, runs are interleaved: each round runs every function
once, rotating which goes first, so drift over a long run lands on every function
alike. The stop policy then counts rounds. The budget becomes --budget times the
number of functions, and --stable waits until every function meets the target.
--order sequential runs each function's runs in turn instead. --isolate runs
each function's whole policy in its own process, and --repeat N runs N processes
per function; as in nano-bench, the test then compares per-process medians.
To answer a question instead of reaching a precision, --settle 5 keeps running
rounds until every pair of functions either differs by at least 5% or is shown to
be within 5%, judged on the CI of the ratio of their medians:
npx nano-bench-io io-bench.js --settle 5 # is either one at least 5% faster?The module format is the same. Optional prepare() / teardown() named exports
run untimed around every run. Warmup is auto-detected and discarded with a note
(--warmup N pins it, --warmup 0 keeps everything). Slow outliers are
flagged, distinguishing caching (slow first run) from interference (scattered
slow runs).
It also benchmarks whole commands (-c), with --prepare <cmd> running untimed
before every run — like hyperfine, but with nonparametric statistics and
tail percentiles:
npx nano-bench-io -c 'node script.js' 'bun script.js'To measure under load, --in-flight 8 keeps 8 calls running (a closed loop), and
--rate 200 starts 200 calls a second whether or not earlier ones have finished (an open
loop). The open loop counts latency from each call's intended start, so a backlog shows in
the tail instead of hiding in the arrivals, and calls past --max-in-flight are dropped and
counted. Functions take turns in phases of --phase milliseconds, and a table reports the
calls per second each one sustained:
npx nano-bench-io api-bench.js --rate 200Add -M / --metrics for per-run system metrics: CPU, page faults, and context
switches for module functions (any runtime); peak RSS, I/O bytes, and syscall
counts for commands (Linux).
Full documentation is in the wiki — browse the index, or search it by name.
Pass -o / --observe to nano-bench to emit
User Timing
marks at calibration and sampling phase boundaries. Marks are written to the
standard performance timeline and are observable via PerformanceObserver or
visible in DevTools / node --inspect traces — useful for correlating
benchmark variability with GC pauses, V8 optimization events, etc.
Mark / measure names follow nano-bench/<function-name>/<phase>, where phase is
find-level (calibration) or rounds / series / series-par (sample collection; rounds, the
interleaved default, uses the label all).
import {PerformanceObserver} from 'node:perf_hooks';

const obs = new PerformanceObserver(list => {
  for (const e of list.getEntries()) {
    console.log(e.name, e.duration.toFixed(2), 'ms');
  }
});
obs.observe({entryTypes: ['measure']});
Marks have a small fixed cost per phase (no per-sample overhead), so leaving
--observe on does not affect measurement accuracy. Default is off.
Library users can opt in directly: findLevel / benchmarkSeries /
benchmarkSeriesPar / benchmarkRounds / measure / measurePar all accept an observe option
(boolean | string) — false / unset for no marks, true for the default
label, or a string for a custom label.
AI agents and AI-assisted developers: read AGENTS.md first for project rules and conventions.
Other useful files:
- ARCHITECTURE.md — module map, dependency graph, how benchmarking works.
- CONTRIBUTING.md — development workflow and coding conventions.
- llms.txt — project summary for LLMs.
- llms-full.txt — detailed CLI reference for LLMs.
BSD 3-Clause License
- 1.3.0: Added browser benchmarking (
nano-bench-viewwith its viewer and runner,nano-bench-playwright,nano-bench-puppeteer),nano-bench-suite, load modes,--isolate, and--settle. Samples are now interleaved by default. - 1.2.0: Added
nano-bench-iofor slow (ms-scale) functions and whole commands: per-run collection with p90/p99 tails, system metrics, warmup auto-detection, and multimodal cluster splitting. Added the--smokepre-flight and effect sizes (Cliff's δ). Bugfixes. - 1.1.0: Added saving to JSON,
nano-bench-comparefor comparing runs distribution histograms, and Holm/Bonferroni multiple-comparison. Also per-function selection and afindLeveltermination fix. - 1.0.16: Added User Timing API integration:
--observeflag. - 1.0.15: Updated dependencies.
- 1.0.14: Fixed Kruskal-Wallis post-hoc (Conover-Iman) pairwise comparison bug: corrected rank variance computation and critical value distribution. Added regression test.
- 1.0.13: Improved CLI help texts and documentation for brevity and clarity.
- 1.0.12: Added AI coding skills for writing benchmark files (write-bench, write-watch), shipped via npm. Added findLevel() tests. Expanded test suite.
- 1.0.11: Fixed MedianCounter.clone() bug, expanded test suite (204 tests), added CodeQL workflow, multi-OS CI matrix, and new Windsurf workflows.
- 1.0.10: Added Prettier lint scripts, GitHub issue templates, Copilot instructions, and Windsurf workflows.
- 1.0.9: Updated dependencies.
- 1.0.8: Updated dependencies.
- 1.0.7: Updated dependencies.
- 1.0.6: Updated dependencies.
- 1.0.5: Updated dependencies.
- 1.0.4: Updated dependencies + added more tests.
- 1.0.3: Updated dependencies.
- 1.0.2: Added the
--selfoption. - 1.0.1: Added "self" argument to utilities so it can be used with Deno, Bun, etc.
- 1.0.0: Initial release.
The full release notes are in the wiki: Release notes.